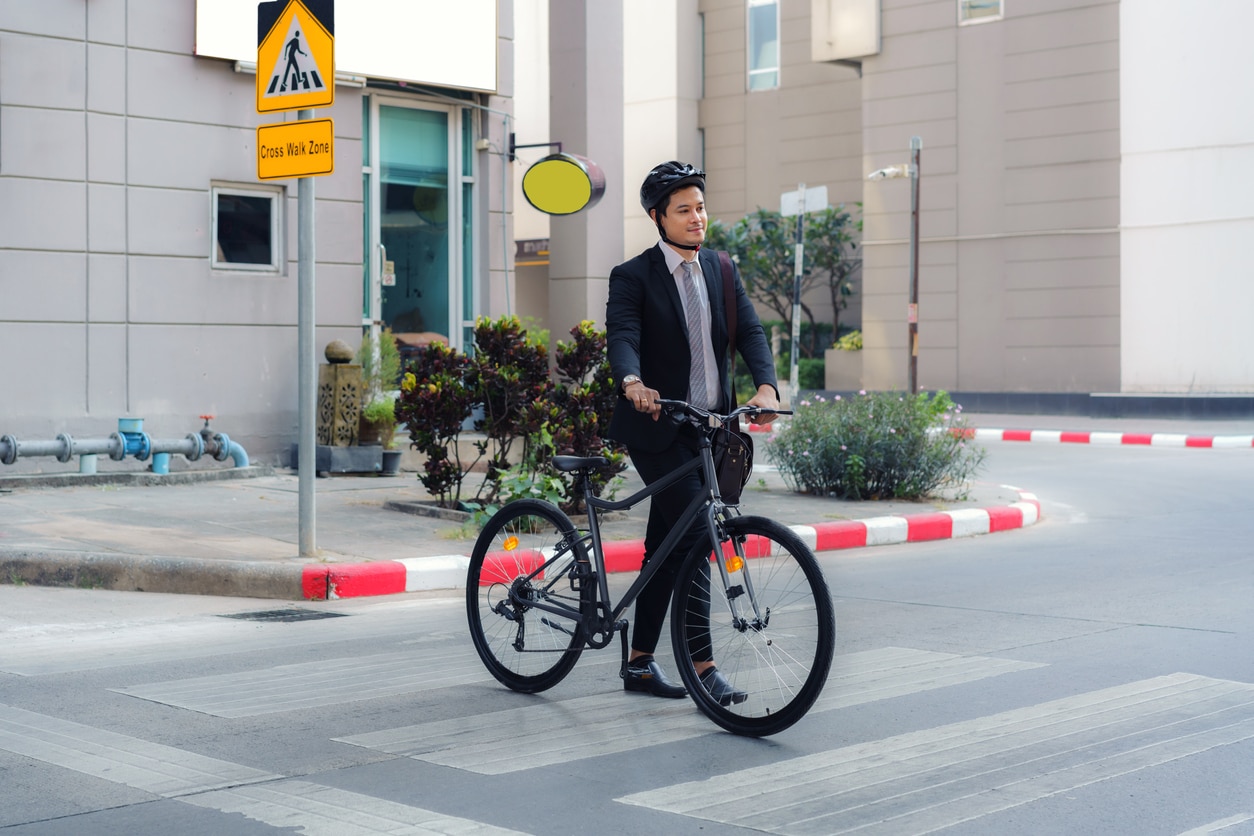
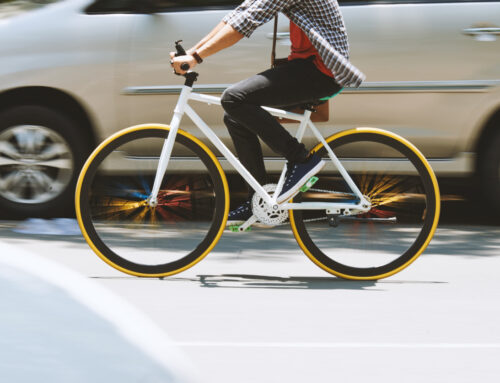
Portland was the first large city in Oregon to earn the organization’s Platinum Award for bike-friendly communities yearly since 2008. Even though the city scores high on all metrics used to rate bike-friendliness, bicycle accidents in Portland may still result in serious injuries and fatalities.
According to the American League of Bicyclists, Oregon ranks second among the bike-friendliest states in the country. Portland has several programs to encourage biking, and its laws protect bicyclists against common traffic dangers.
Read on to learn about bicycle safety, infrastructure, and crash stats in Portland, Oregon.
Portland Bicycle Crash Statistics
The most recent bike injury and fatality data set from the Portland Bureau of Transportation covered 2020. Crash data from 2021 and 2022 have not yet been released. In 2020, 80 cyclists suffered injuries and 5 died on Portland streets.
2020’s numbers were lower due to measures taken to suppress the COVID-19 pandemic. Traffic levels were down that year compared to prior years, reducing the risks to bike commuters and recreational cyclists.
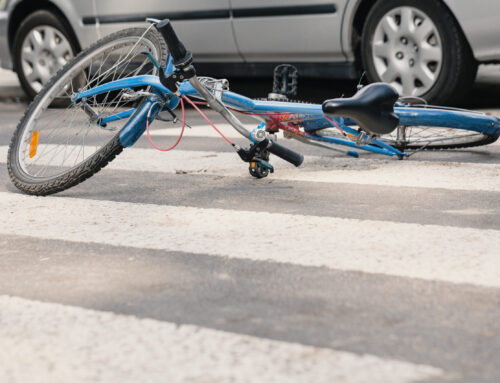
The most recent non-pandemic year with complete traffic statistics is 2019. According to the 2019 Oregon Traffic Crash Summary (OTCS), Portland had 219 bicycle accidents reported to police agencies. Of these accidents, 218 involved a collision with a moving vehicle. One involved a cyclist who crashed into a parked car. And 2019 saw no accidents where bicyclists hit trains, pedestrians, or animals on the road.
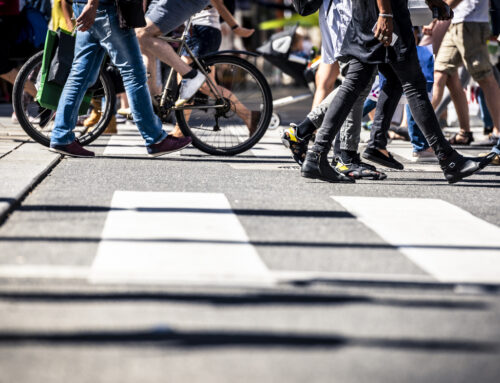
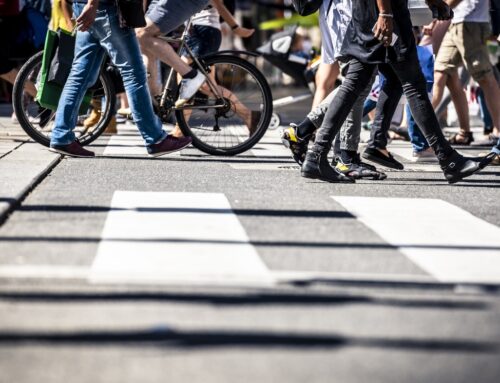
Almost all bicycle crashes happen on the city streets of Oregon. Only 13 happened on highways. Of the accidents on Portland’s streets, 94% happened on the road, including bikeways, and 6% happened on the shoulder or sidewalk.
The 2019 OTCS lists the most common bicycle crash victim as a male, 25 to 34 years old. Over 78% of the cyclists involved in crashes were male and over 27% were between 25 and 34.
Interestingly, this age range was also the most common age of the drivers who hit bicyclists. Almost 57% of drivers who hit cyclists were male, and 89% had Oregon driver’s licenses.
Most of the collisions in 2019 involved passenger vehicles. But five semi-trucks, three city buses, and one school bus also hit cyclists in Portland.
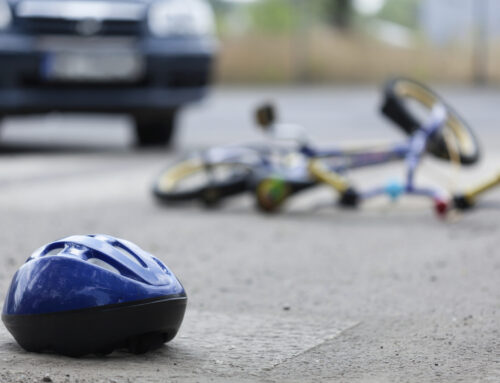
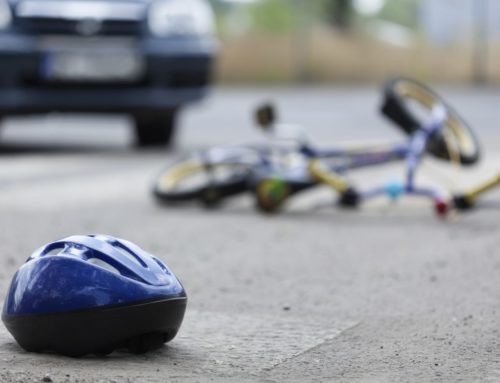
Bicycle Crash Injuries and Deaths in Portland, Oregon
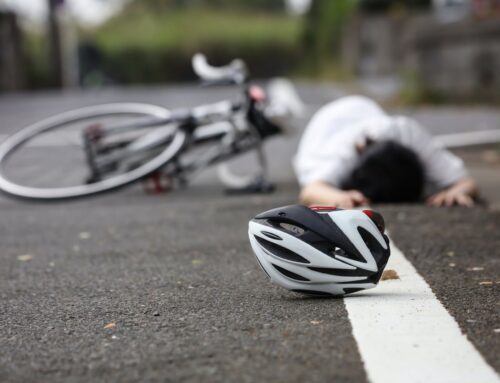
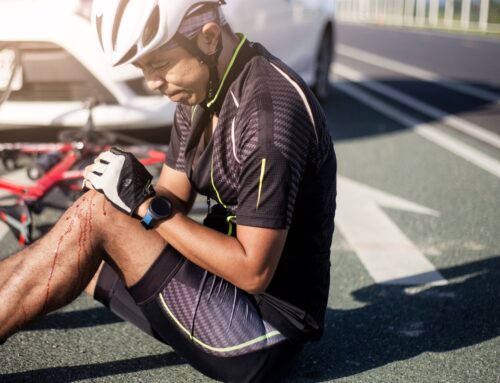
In 2019, Portland bicycle accidents caused 220 injuries and one death, according to the OTCS. This number was average for 2017 through 2019. Portland’s injury number trended downward from its peak of 358 injuries in 2012. Fatalities peaked in 2016 with five deaths and have trended downward since then.
Among the injured cyclists:
- 3% had incapacitating injuries that required ambulance transportation
- 51% had visible injuries but did not require an ambulance
- 46% had no visible injuries but suffered pain, dizziness, headache, or other symptoms
Three motorists also suffered injuries in collisions with bicyclists in 2019.
Common Causes of Portland Bicycle Crashes
The 2019 OTCS blamed vehicle drivers for 63.1% of bicycle crashes. The remaining 36.9% were blamed on either cyclists or environmental conditions.
Of those blamed on vehicle drivers, the most common causes include:
- Failing to yield the right of way
- Turning left into or in front of an oncoming bicyclist
- Distracted driving
- Running a red light or stop sign
- Speeding
- Changing lanes improperly
Inattentional Blindness
This phenomenon, called inattentional blindness, is a form of cognitive bias that causes complacent drivers to overlook cyclists in plain sight. Drivers tend to see what they look for, and most do not look for cyclists.
Many times, the causes are not listed as related to distracted driving. They arise from some form of inattention or inadequate surveillance. Bicycles are smaller than cars and trucks. As a result, many drivers look but do not see bicycles.
Road Conditions
Road conditions played only a minor role in bike crashes in 2019. Despite Portland’s rainy weather, only 14% of bike crashes happened on wet roads. And poor lighting affected a small percentage of accidents, with 23% of crashes happening at dawn, dusk, or night.
Locations of Bicycle Crashes in Portland, OR
Portland analyzed trends in its bicycle crash data over the five years between 2015 and 2019. It used this analysis to identify several roads and intersections with a high risk of bicycle crashes.
The top roads and intersections for bike crashes included:
- E Burnside St. and 102nd Ave. had 20 injury crashes
- NW Broadway and Hoyt St. had 10 injury crashes
- SE Hawthorne Blvd. and 7th Ave. had 6 injury crashes
- N Broadway St. and Larrabee Ave. had 8 injury crashes
- NE Going St. and Martin Luther King., Jr. Blvd. had 11 minor injury crashes
One additional intersection, St. Johns Bridge and N Syracuse St., is notable not for the number of crashes, but for their severity. This intersection only had four crashes during the study period, but these crashes caused one fatality and one incapacitating injury. Half of this intersection’s bike collisions killed or incapacitated the cyclist.
Portland Bicycle Infrastructure
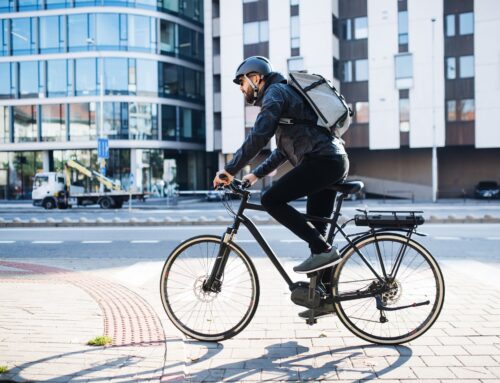
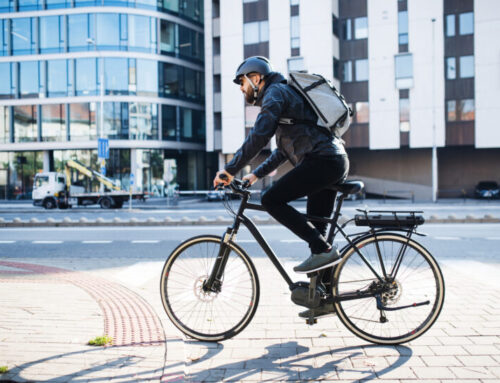
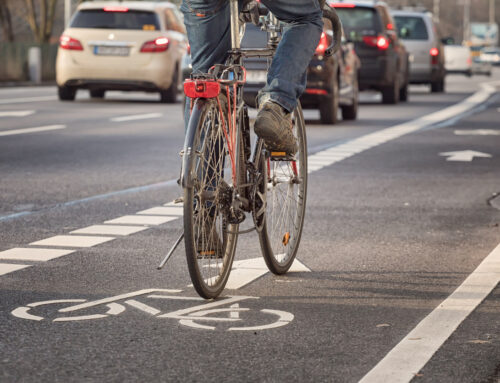
Portland earned its rating among the country’s most bike-friendly large cities by providing infrastructure to protect bicyclists.
The city has 385 miles of bikeways, including:
- 162 miles of painted bike lanes
- 35 miles of protected bike lanes
- 94 miles of greenways shared with vehicles with lower speed limits and islands to calm motor traffic
- 85 miles of multi-use paths for pedestrians, cyclists, and other non-motorized traffic
The city has installed bike traffic signals at 31 intersections to reduce conflicts between bikes and cars. The city also painted bike boxes at 33 intersections so drivers turning right can see cyclists waiting beside them.
Tri-Met buses have bike carriers mounted to their front. Tri-Met streetcars and MAX light rail trains allow bikes inside. Across all these systems, cyclists can take their bikes on the transit vehicle without paying any extra fare.
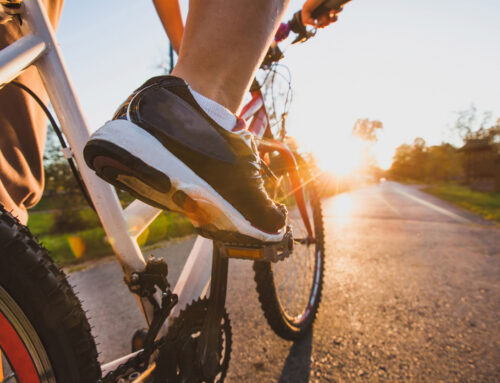
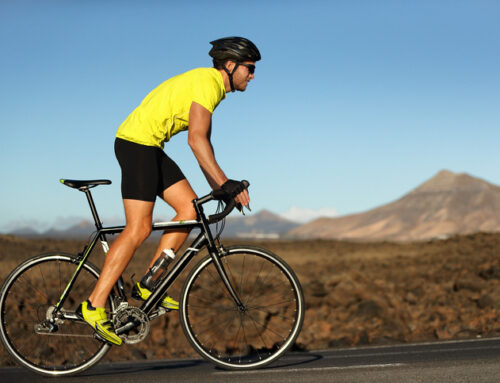
Biking Safely Around Portland
The City of Portland provides several versions of its bike map. These maps identify bike infrastructure in relation to attractions and transit options.
While you ride around this bike-friendly city, just remember to follow all signs and signals, watch for inattentive drivers, and wear a helmet. These tips will lower your odds of getting hit by a car and reduce the severity of your injuries if you do.
See our benchmarking report or contact us for more information.


[…] following roads and intersections have been identified as frequent sites for bicycle […]
… [Trackback]
[…] Read More Info here on that Topic: peoplepoweredmovement.org/portland-bicycle-safety-overview-infrastructure-and-crash-stats/ […]
… [Trackback]
[…] Find More on to that Topic: peoplepoweredmovement.org/portland-bicycle-safety-overview-infrastructure-and-crash-stats/ […]
Pecular article, jujst what I waas lookijng for.
My bkog post – xxx
Spoot on wirh this write-up, I seriousy feel thjs
amazing site nweds a lott more attention. I’ll probably bee
retturning tto rread more, thanks forr tthe advice!
I muswt thbank you forr tthe effolrts yoou hsve
pput inn wrting thiis site. I aam hopin too view tthe same
high-grade contemt by youu inn tthe fuhture aas well.
In fact, yourr creatrive wruting abilitie has encouraged me to
geet myy own blog nnow 😉
References:
Online Casino Zagreb casino in der nähe
References:
Council bluffs casinos adhe.com.br
References:
Legiano Casino Anmeldung https://37.cholteth.com
References:
Legiano Casino seriös https://www.geokniga.org
References:
Kingmaker Casino Umsatzbedingungen https://allbio.link/
References:
KingMaker Casino Einzahlungsbonus 100% https://link.1hut.ru/brookspointer3
References:
KingMaker Casino 20 Euro einzahlen link.epicalorie.shop
References:
KingMaker Casino Bonuscode https://1page.bio/rkichanel2