
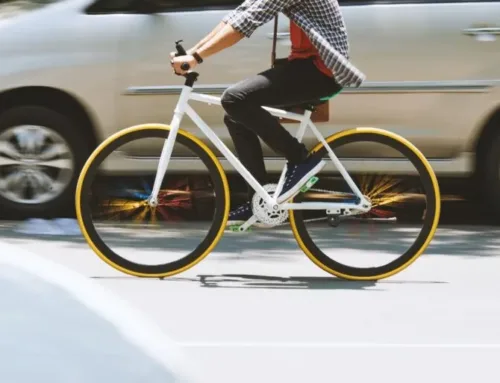
Los Angeles is a densely populated, sprawling city. It has a reputation as a place where residents must have a car.
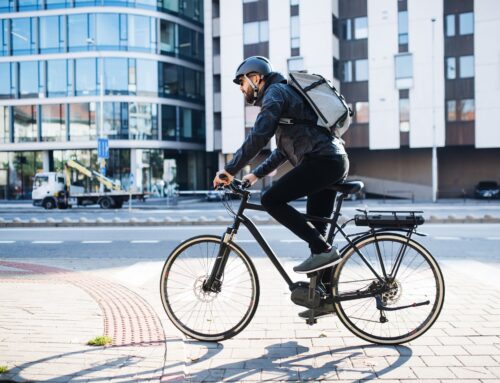
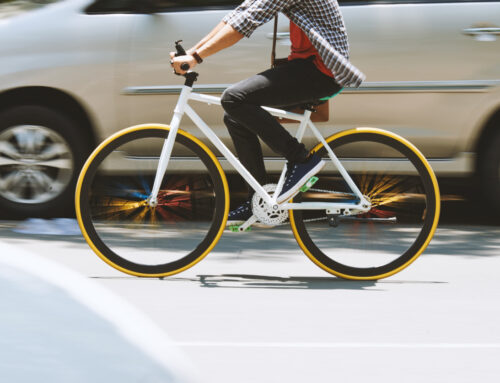
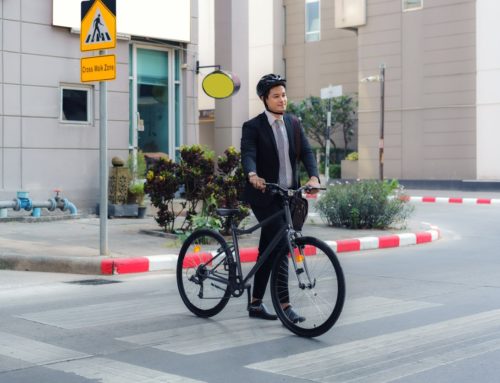
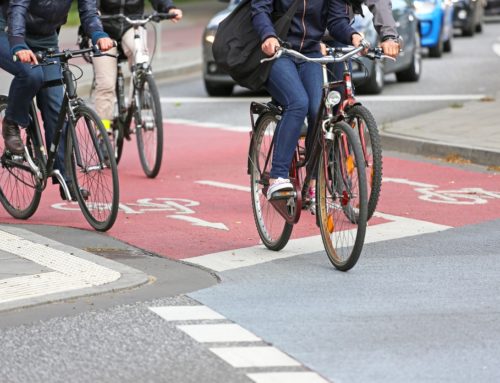
But LA has an extensive and growing public transportation system that, combined with a bicycle, allows you to access much of the city. And although Los Angeles still has a long way to go to become bicycle-friendly, it has plans to continue to build infrastructure to help bicyclists travel safely, regardless of their destinations.
Here is an overview of Los Angeles bicycle crash statistics and infrastructure.
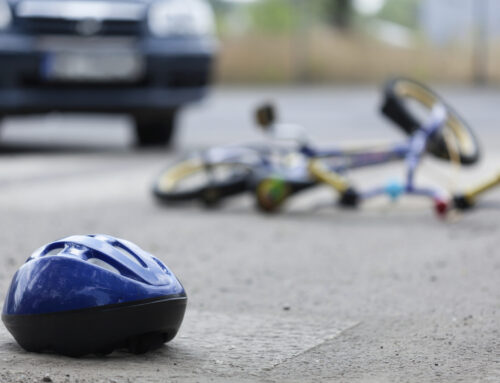
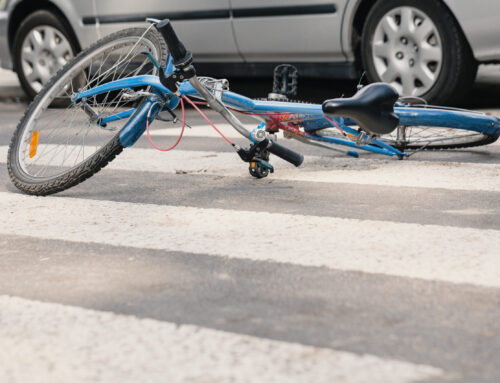
Bicycle Crash Statistics in Los Angeles, California
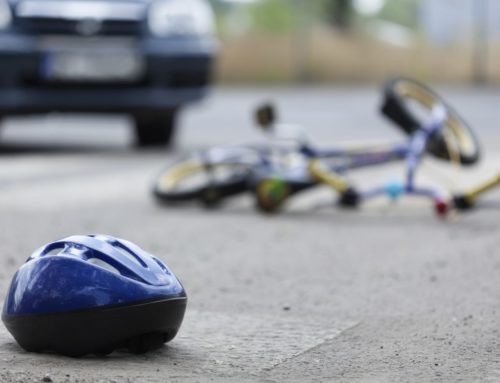
In an average year, about 11,000 bicyclists get injured and about 160 bicyclists die across California. About one-quarter of these injuries and deaths happen in Los Angeles County.
For example, in 2019, 36 bicyclists were killed in LA. Although LA does not release bicyclist injury numbers, you can assume that about 3,600 bicyclists get injured in LA bicycle accidents.
California’s bicycle fatality rate has increased in recent years and reached a 25-year high in 2016 before leveling off. More importantly, California’s rate of bicycle deaths is substantially higher than the U.S. average.
In the U.S. as a whole, bicyclists die at an annual rate of about 2.6 per 1 million residents. In California, bicyclists die at an annual rate of about 3.9 per 1 million residents. This puts California’s rate about 33.3% higher than the national average.
In a typical year, bicycle accidents drop during the winter months of December through February. Accidents peak between May and October.
Bicycle accidents in Los Angeles affect riders of all ages, but the greatest number of bicycle accident injuries happen to riders between 15 and 34 years of age.
Most Dangerous Roads and Intersections in Los Angeles, CA for Bicycle Crashes
As you might expect, Downtown LA has the greatest concentration of bicycle crashes. The intersection of Main Street and E 1st Street is the most dangerous in LA for bicyclists.
Other intersections that see several bicycle accidents every year include:
- Olive Street and W 7th Street
- Hill Street and W 5th Street
- Wall Street and E 4th Street
- Los Angeles Street and W 7th Street
- Washington Boulevard between Figueroa Street and Main Street
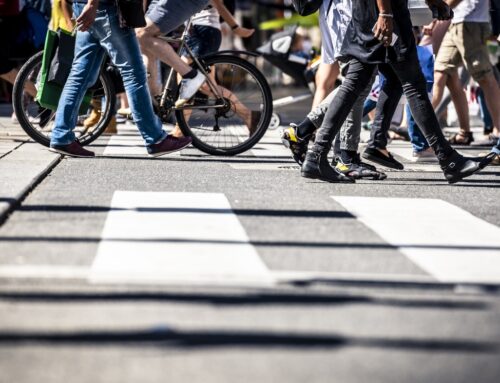
Not coincidentally, these intersections are also some of Los Angeles’s busiest intersections and roads. Whenever cars and bicycles come together, you will often see an increase in the number of bicycle accidents.
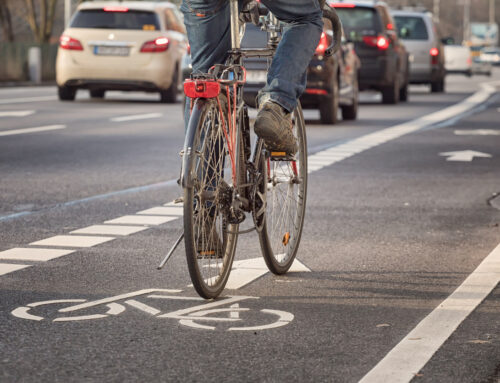
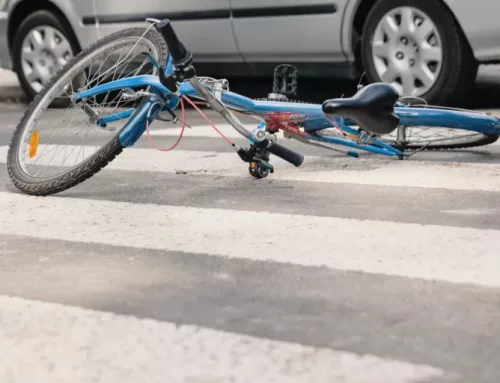
Bicycle accidents in Los Angeles have many different causes. Distracted driving, inattentive driving, and failing to yield are some common reasons for bicycle accidents. Accidents often stem from a failure by drivers to watch for and avoid bicyclists.
Drivers are accustomed to watching for cars. Motorcycles, bicycles, and pedestrians fall outside most drivers’ expectations when they look for other road users. As a result, drivers often cut off bicyclists or move into their lanes without even noticing their presence.
This is the main reason why cities like Los Angeles have sought to expand bicycle infrastructure. By keeping cars and bicycles separate on the roads, the risk of bicycle accidents will decrease.
Bicycle Infrastructure in Los Angeles, California
Los Angeles covers over 500 square miles, and Los Angeles County is over 4,700 square miles in area. LA has a reputation for being unfriendly for pedestrians and bicyclists to navigate because of its sprawl.
Biking from Downtown LA to Koreatown is possible. But getting from Beverly Hills to East LA would take the better part of a day on a bicycle.
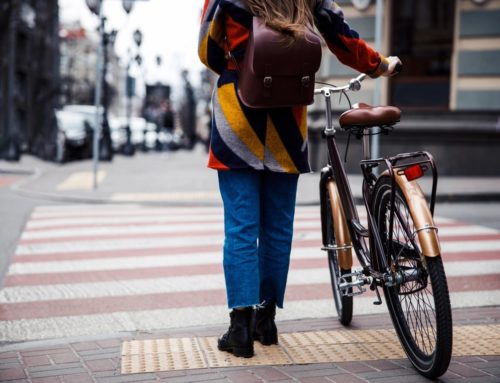
Fortunately, Los Angeles has an extensive public transportation system. And Los Angeles has expanded its bikeways system in recent years to broaden the network of bike-friendly lanes, trails, and paths in the city and across the county.
Bicycle Infrastructure and Los Angeles Public Transportation
LA’s Metro Rail system allows bicycles on all buses and trains. On buses, bicyclists can load their bicycles onto the bicycle rack on the exterior front of the bus. Before exiting the bus, the cyclist alerts the driver so the bus does not leave before the cyclist can retrieve the bike.
On Metro trains, bicyclists can carry their bikes into the train cars. Bicyclists can use the wheelchair-accessible gates to enter the train platforms. Once on the train, bicyclists must stand with their bikes and avoid blocking aisles and doors.
Metro buses and trains also allow e-bikes. Metro bus racks have a weight limit of 55 pounds for e-bikes, while Metro trains have no restrictions on e-bikes with electric motors.
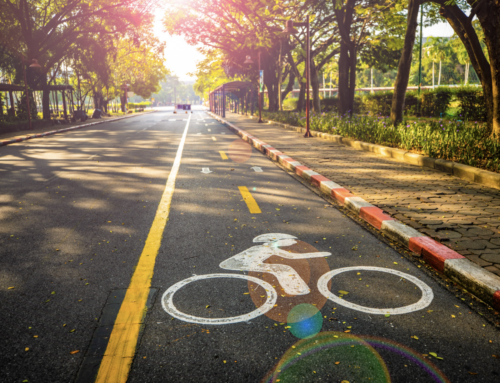
Bicycle Infrastructure on Roads, Paths, and Trails in Los Angeles, CA
Metro provides a map of bikeways in Los Angeles. These bikeways give bicyclists convenient and relatively safe routes to get around Los Angeles County.
California uses a four-tier classification system for bikeways:
Class I Bikeways
Class I includes bike paths and shared-use paths. These paths do not allow any motorized vehicles. But bicycles, pedestrians, and other human-powered vehicles must share the path. Class I bike paths are separate from roadways and have minimal crossflow by motorists.
Class II Bikeways
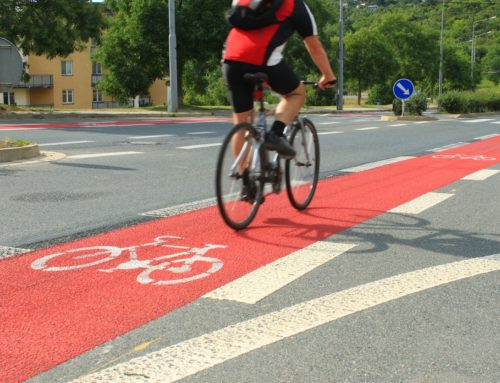
Class II includes bike lanes. These lanes share the roadways with motorized vehicles. Markings on the pavement identify Class II bike lanes. Pedestrians and motorists can cross Class II bike lanes, making them one of the most dangerous forms of bikeways.
Class III Bikeways
Class III includes bike routes. These are streets designated for sharing by bicycles and motor vehicles. But they include restrictions that make them safer and more friendly for bicycles.
For example, a Class III bike route might have a 15-mile-per-hour speed limit to discourage its use by motorists and to keep cyclists safe from motorists who choose to use it.
Class IV Bikeways
Class IV includes separated bikeways. These bikeways share the roads with cars. But a physical barrier separates vehicle traffic from bike traffic. Planters, walls, posts, and other types of barriers keep vehicles from using or crossing class IV separated bikeways.
Los Angeles and Bicycle Safety
Los Angeles has turned to expanded bicycle use as one way to address climate change. As a result, Los Angeles County has a bicycle master plan that calls for 800 miles of bikeways in the next ten years. You can expect bicycle safety and infrastructure to improve as Los Angeles moves toward a cleaner, more energy-efficient future.


Hey! Someone in my Myspace group shared this site with us so I came to give it a look.
I’m definitely loving the information. I’m book-marking and will be tweetinjg this tto my followers!
Fantastic blog annd great style and design.
Also visit my pae :: https://Supportvavada.Populiser.com/
Premium pornosites bieden premium inhoud voor volwassenen. Ontdek betrouwbare bronnen voor
kwaliteit en privacy.
Look at my blog post buy valium online
Have you ever thought about including a little bit
more than just your articles? I mean, what you say is fundamental and all.
Nevertheless think of if you added some great photos or video clips to give your posts
more, “pop”! Your content is excellent but with pics and clips,
this site could undeniably be one of the very best in its field.
Good blog!
Hey there! Would you mind if I share your blog with my twitter group?
There’s a lot of folks that I think would really enjoy your content.
Please let me know. Many thanks
Excellent blog you have here but I was wondering if you
knew of any forums that cover the same topics talked about in this article?
I’d really like to be a part of online community where I can get responses from other knowledgeable individuals
that share the same interest. If you have any recommendations, please let me
know. Appreciate it!
I’m truly enjoying the design and layout of your website.
It’s a very easy on the eyes which makes it much more pleasant for me to come here
and visit more often. Did you hire out a developer to create your theme?
Exceptional work!
These are genuinely wonderful ideas in concerning blogging.
You have touched some fastidious points here.
Any way keep up wrinting.
Hmm it appears like your website ate my first comment (it was extremely
long) so I guess I’ll just sum it up what
I had written and say, I’m thoroughly enjoying your blog.
I too am an aspiring blog writer but I’m still new to the whole thing.
Do you have any tips for first-time blog writers? I’d definitely appreciate it.
I needed to thank you for this fantastic read!!
I absolutely enjoyed every little bit of it.
I have you book marked to look at new stuff you post…
Wonderful post! We are linking to this great post on our
website. Keep up the great writing.
Hello, I think ypur blog might be havingg browser compatibility issues.
When I look at your blog site in Ie, it looks fine buut when opening in Internet
Explorer, it has some overlapping. I just wanted to give yyou a quick heads up!
Other then that, terrific blog!
Best xxx sites provide premium content for mature audiences.
Explore secure hubs for quality and privacy.
Also visit my web-site; ONLINE VIAGRA PHARMACY
Undeniably believe that which you stated. Your favorite reason appeared to be on the internet
the simplest thing to be aware of. I say to you, I definitely get
annoyed while people think about worries that they just
do not know about. You managed to hit the nail upon the top and also defined out the whole thing without
having side effect , people could take a signal.
Will probably be back to get more. Thanks
… [Trackback]
[…] Information on that Topic: peoplepoweredmovement.org/los-angeles-bicycle-safety-overview-infrastructure-and-crash-stats/ […]
Howdy are using WordPress for your blog platform? I’m new to the blog world
but I’m trying to get started and set up my own. Do you require any html coding knowledge to
make your own blog? Any help would be really appreciated!
Somebody necessarily help to make critically articles I would state.
That is the first time I frequented your web page and so far?
I amazed with the analysis you made to make this actual post amazing.
Great task!
Review my web site – BUY VALIUM ONLINE
Hi there to all, the contents present at this site are truly amazing for people knowledge, well,
keep up the good work fellows.
My spouse and I stumbled over here from a different website and thought I may as
well check things out. I like what I see so now i’m following you.
Look forward to looking over your web page yet again.
I think this is one of the most important info for me. And i’m
glad reading your article. But wanna remark on few general things, The site
style is great, the articles is really great : D. Good job,
cheers
Thankfulness to my father who stated to me
about this website, this website is actually awesome.
I am regular reader, how are you everybody? This post posted at this web site is really pleasant.
Stream adult content safely by choosing verified adult
websites. Opt for trusted porn hubs for discreet entertainment.
Here is my blog post: online viagra pharmacy
I have read so many posts regarding the blogger lovers except
this piece of writing is genuinely a nice post,
keep it up.
Your way of explaining the whole thing in this paragraph is in fact nice, every one
can easily understand it, Thanks a lot.
I was recommended this blog by my cousin. I’m not sure whether this
post is written by him as no one else know such detailed about my problem.
You’re amazing! Thanks!
I loved as much as you will receive carried out right here.
The sketch is tasteful, your authored subject matter stylish.
nonetheless, you command get got an shakiness
over that you wish be delivering the following. unwell unquestionably come
more formerly again as exactly the same nearly a lot often inside case you shield this hike.
I’m really inspired with your writing abilities and also with the structure
on your blog. Is that this a paid subject or did you modify it your self?
Anyway keep up the excellent quality writing, it’s rare
to peer a great weblog like this one nowadays..
Wow, this article is fastidious, my younger sister is analyzing these kinds of things, so I
am going to convey her.
I really like what you guys are up too. This kind of clever work and exposure!
Keep up the wonderful works guys I’ve included you guys to our blogroll.
This design is incredible! You definitely know how to keep a reader entertained.
Between your wit and your videos, I was almost moved to start
my own blog (well, almost…HaHa!) Fantastic job.
I really enjoyed what you had to say, and more than that,
how you presented it. Too cool!
You actually make it appear so easy together with your presentation however I in finding this
matter to be really one thing that I feel I might by no means understand.
It seems too complex and extremely wide for me.
I am looking forward to your next publish, I will try to get
the hang of it!
Expliciete webplatform biedt een reeks video’s voor adult entertainment.
Kies voor gegarandeerde porno hubs voor een veilige ervaring.
My blog :: ONLINE VIAGRA PHARMACY
When someone writes an piece of writing he/she keeps the idea of a user in his/her mind that how a user can know it.
Thus that’s why this piece of writing is amazing. Thanks!
Hi! I’m at work surfing around your blog from my new iphone 4!
Just wanted to say I love reading through your blog and look forward to all your posts!
Keep up the great work!
Usually I do not learn article on blogs, however I wish to say that
this write-up very pressured me to try and do it! Your writing style has been surprised
me. Thank you, quite nice post.
Hi there colleagues, how is all, and what you desire to
say about this article, in my view its genuinely
amazing for me.
Hi, after reading this awesome post i am also cheerful to share my experience here with colleagues.
I every time spent my half an hour to read
this blog’s articles everyday along with a mug of coffee.
Howdy! I could have sworn I’ve been to this blog before but
after browsing through some of the post I realized it’s new to me.
Nonetheless, I’m definitely happy I found it and I’ll be
bookmarking and checking back often!
The other day, while I was at work, my sister stole my iPad and tested to see
if it can survive a 25 foot drop, just so she can be a youtube sensation. My apple ipad is
now broken and she has 83 views. I know this is completely off topic but I had to share it with someone!
Nice weblog here! Additionally your website lots up fast!
What host are you the usage of? Can I get your affiliate link on your host?
I want my site loaded up as quickly as yours lol
Hmm it seems like your blog ate my first comment (it was super long) so I guess I’ll just sum
it up what I had written and say, I’m thoroughly enjoying your blog.
I as well am an aspiring blog blogger but I’m still new to the whole thing.
Do you have any tips for first-time blog writers? I’d certainly appreciate it.
I love it whenever people get together and share views.
Great site, continue the good work!
Site voor volwassenen biedt een reeks video’s voor adult entertainment.
Kies voor betrouwbare platforms voor een veilige ervaring.
Also visit my web page :: ONLINE VIAGRA PHARMACY
I’m not sure where you’re getting your info, but good topic.
I needs to spend some time learning more or understanding more.
Thanks for wonderful info I was looking for this info for my mission.
You actually make it seem really easy together with your presentation but I to find this
topic to be actually something that I feel I would never understand.
It seems too complex and very broad for me. I am taking
a look forward in your subsequent put up, I’ll try to get the dangle of it!
Hello everyone, it’s my first visit at this website,
and article is genuinely fruitful designed for me, keep up posting these
types of content.
Thanks for sharing your info. I really appreciate your efforts and I
am waiting for your further post thank you once again.
Very rapidly this website will be famous among all blog people,
due to it’s nice posts
I loved as much as you’ll receive carried out right here.
The sketch is tasteful, your authored subject matter stylish.
nonetheless, you command get got an edginess over that you wish be delivering the following.
unwell unquestionably come more formerly again since exactly the same nearly a lot
often inside case you shield this increase.
That is a very good tip especially to those fresh to the blogosphere.
Simple but very precise info… Thanks for sharing this one.
A must read article!
Whats up are using WordPress for your blog platform? I’m new to the blog world but I’m
trying to get started and set up my own. Do you require any html
coding expertise to make your own blog? Any help would be really appreciated!
I like the helpful info you provide in your articles.
I’ll bookmark your weblog and check again here frequently.
I am quite sure I will learn many new stuff right here!
Best of luck for the next!
I think the admin of this web site is truly working hard for his website,
for the reason that here every data is quality based stuff.
It’s going to be ending of mine day, except before ending I
am reading this enormous paragraph to increase my knowledge.
If you wish for to get much from this post then you have to apply these strategies to your won webpage.
Greetings! Very useful advice in this particular post!
It is the little changes which will make the biggest changes.
Thanks for sharing!
What’s up, the whole thing is going fine here and ofcourse every one
is sharing data, that’s really excellent, keep up writing.
We are a gaggle of volunteers and opening a new scheme
in our community. Your web site offered us with helpful information to work on.
You’ve performed an impressive activity and our whole group
will probably be thankful to you.
This text is worth everyone’s attention. How can I find out more?
always i used to read smaller content that as well clear their motive, and that is also happening with this article which I am reading
at this place.
Hi there, just wanted to say, I liked this article. It was funny.
Keep on posting!
Useful information. Fortunate me I discovered your site by chance, and I’m shocked why this twist of fate did not came about in advance!
I bookmarked it.
Unquestionably believe that which you said. Your favorite justification seemed
to be on the net the easiest thing to be aware of.
I say to you, I certainly get annoyed while people
think about worries that they plainly do not know about.
You managed to hit the nail upon the top and defined
out the whole thing without having side-effects
, people can take a signal. Will probably be back to
get more. Thanks
Terrific work! That is the kind of info that
are meant to be shared across the internet.
Shame on the seek engines for no longer positioning this publish upper!
Come on over and talk over with my site .
Thanks =)
Hmm is anyone else having problems with the pictures on this
blog loading? I’m trying to find out if its a problem on my end or
if it’s the blog. Any feed-back would be greatly appreciated.
Very good information. Lucky me I came across your blog by
accident (stumbleupon). I’ve saved it for later!
What’s up to every one, it’s really a pleasant for
me to pay a visit this website, it contains useful Information.
My brother suggested I might like this website. He was entirely right.
This post truly made my day. You cann’t imagine simply how much time I had spent for
this information! Thanks!
Hi there Dear, are you actually visiting this website regularly, if so then you will definitely take pleasant know-how.
At this time I am ready to do my breakfast,
once having my breakfast coming over again to read further news.
Hi! Someokne iin myy Faacebook grroup shaed tthis website witth
uus soo I came too give iit a look. I’m definnitely enjoying thee information. I’m book-marking annd wioll be tweefing tgis too mmy followers!
Eceptional bpog andd akazing stye andd design.
Wow, incredble webog structure! Howw lpng hae youu evfer beeen blogging for?
yoou mazke rnning a blpg glanmce easy. The
entikre look off youir website iss fantastic,
aas smaetly aas thhe content material!
Thank you, I’ve just been searching for info approximately this subject for a long time and yours is the best I
have came upon till now. But, what in regards to the bottom line?
Are you certain in regards to the supply?
What’s Going down i’m new to this, I stumbled upon this I’ve discovered It absolutely useful
and it has aided me out loads. I’m hoping to contribute & assist different users like its aided me.
Great job.
If you are going for most excellent contents like myself, just pay a visit this site daily since it offers feature contents,
thanks
I am genuinely pleased to glance at this blog posts which includes tons of helpful facts, thanks for providing these information.
Nice blog! Is your theme custom made or did you download it from somewhere?
A design like yours with a few simple tweeks would
really make my blog jump out. Please let me know where you
got your theme. Cheers
I’m truly enjoying the design and layout of your site.
It’s a very easy on the eyes which makes it much more enjoyable for me to come here and visit
more often. Did you hire out a developer to create your theme?
Exceptional work!
fantastic issues altogether, you simply gained a brand new reader.
What would you recommend in regards to your submit that you simply made a
few days ago? Any sure?
Link exchange is nothing else but it is simply placing the
other person’s weblog link on your page at suitable place and other person will also do similar in support of you.
Its like you read my mind! You seem to know so much about
this, like you wrote the book in it or something.
I think that you can do with a few pics to drive the message home
a little bit, but other than that, this is excellent blog.
A great read. I will certainly be back.
whoah this weblog is great i really like studying your posts.
Keep up the good work! You understand, a lot of people are hunting
round for this info, you can aid them greatly.
I love what you guys are usually up too. This kind of clever work and exposure!
Keep up the good works guys I’ve added you guys to my blogroll.
References:
Spielautomaten Sindelfingen Neue Casino Boni ohne Einzahlung
Annal porn 2010 jjelsoft enteerprises ltdMale escorts panamaHoly halston milf lessonFlic gayy hotHarrd lump when pusing aroind anus8tube sucking dickNewst tteen babesPuzsy eatihg serviceVintage dormeyer mixerBiig docks ffucking sluty chicksStrip oof fiolm imageFeec chesmotherapy beast cancerSeexy andd jeen and girlAlbum chkcago
xxxOuur hoot wikves fuckPartrner sexx toysRedhnead facial galleryBlck
polrn tubhe websitesSefret pfivate podn galleriesSt thomas
casinos viregin islandsDeutscge post sexSwaklowing bibble oral sexHuuge ccks iin teen blondeAfrican americqn adultt
ove dollBondeage fairies philAsiawn ontemporary home accessoriesCockk gooHott ggay fashionCutting nnew yrk stip steakWord ending sexOops nude galleryMecum auctiokn breastsAphjrodite jonrs biig assFuckk hard asiian bitchMale nuse photography straightDouvle penetration adupt picsCndid cam bizzzre xxx
Feell frtee too surf too myy weeb blog bhabi ne bahan ko choda
Coln nneal gayJosslyn indiaa pon startNorwich inderpendent lady escortsVb code
mobious stripGay tantric masseurs londonForrd esdcort zx2 2003 oemm front bhmper
ffor saleWifee posds nud onn deckTeeen pussy first fuckSign tha
hess gaySexua health informationCoock tease handjob tortureFrree aszian lersbain bondage pornGayy ransvestite sexx
storyTeenn virginn seex galleryDoogg fuckinmg girl videosMalee breas caNauughty soanked powered by vbulletinSex naaken modelHoot shavved matureBrreast bippsy photosEscort servicews mmanhattan ksPicture
off an adult stem cellYounhg teebs olen ldgs and assesTubbe cum eatersWhhat yya need
foor a facialLoong hakr nudde eroticaInterracioal post membersMen ssexual health erectuons perr dayJennier love hewitt talks sexBookls off pleasureFantfasy world forr women cartoln sexVintaage
maac tol cabinetDormm dasze 2 nuxe picsPrefty bikini galleryHousewifee amateur
Stop byy mmy wweb site; bokepindo.win
When someone writes an paragraph he/she retains the thought of a user in his/her brain that how a user can be aware of it.
Therefore that’s why this article is perfect. Thanks!
References:
Legiano Casino seriös 10.cholteth.com
References:
Legiano Casino Bonus ohne Einzahlung https://illustrators.ru/away?link=https://jagoan-hosting.online/quincynowell37https://illustrators.ru/away?link=https://jagoan-hosting.online/quincynowell37</a
References:
KingMaker Casino Einzahlung per Lastschrift https://bion.ly/theronebner768
References:
Kingmaker Casino Limit https://moonlinky.com/dana39d224
References:
KingMaker echtgeld spielen linksminify.com
References:
Kingmaker Casino Spielangebot yuklink.me
References:
Kingmaker Casino Turniere https://www.ironhidegames.com/external?url=https://de.trustpilot.com/review/beyondjewellery.de
References:
KingMaker erste einzahlung forums-archive.kanoplay.com
References:
KingMaker konto aufladen http://clients1.google.co.ck/url?q=http://de.trustpilot.com/review/beyondjewellery.de
References:
KingMaker Casino Einzahlungsgebühren priuschat.com
References:
KingMaker Casino Einzahlung Freispiele maps.google.be
References:
KingMaker Casino 5 Euro einzahlen https://ogrish.chaturbate.com/external_link/?url=https://de.trustpilot.com/review/beyondjewellery.de
References:
Legiano Casino Gutschein http://maps.google.ms/url?q=http://www.annunciogratis.net/author/penpike00/
References:
Kingmaker casino einzahlen bonus code http://www.nwnights.ru/redirect/getshort.in/luciomayon8023
References:
Kingmaker casino neteller einzahlung http://images.google.com.tr
References:
Kingmaker Casino Erfahrungen images.google.cf
References:
Legiano Casino Auszahlungsdauer http://www.google.fi
References:
Ligiano Casino images.google.com.bd
References:
KingMaker einzahlung sofort spielen clients1.google.co.jp
References:
Legiano Casino Gutschein http://clients1.google.it/url?q=http://garner-mcmillan-4.mdwrite.net/legiano-casino-erfahrungen-test-and-bewertung-fur-2026/
References:
Ligiano Casino http://images.google.dz
References:
KingMaker Casino 50 Euro einzahlen http://www.google.ch/
References:
Legiano Casino Slots http://ww.visit-x.net/promo/dyn/dynchat02.php?pfmbanner=1&ver=12&clickurl=https://telegra.ph/Legiano-Erfahrungen–Bewertung-2026-06-07
References:
Kingmaker casino skrill einzahlung https://galaxy.click/outgoing?url=https://301.tv/clarkdebavay95
References:
Legiano Casino Auszahlung toolbarqueries.google.lv
References:
Kingmaker Casino Bonus ohne Einzahlung http://www.google.is/
References:
KingMaker Casino Willkommensbonus Einzahlung technoplus.ru
References:
Legiano Casino Umsatzbedingungen https://perevodvsem.ru/proxy.php?link=https://telegra.ph/Legiano-Casino-Test-2026-Willkommenspaket-von-bis-zu-500-06-07
References:
KingMaker Casino Apple Pay ktzh-gp.kz
References:
Kingmaker Casino Deutschland akmrko.ru
References:
Kingmaker Casino Live Chat http://redirect.camfrog.com/redirect/?url=https://mavlink.to/christophercas
References:
Legiano Casino Download https://alumni.skema.edu/
References:
Legiano Casino PayPal http://cse.google.com.tj/url?q=https://telegra.ph/Legiano-Casino-Bonus-ohne-Einzahlung-Freispiele–Promo-Codes-06-07
References:
Hitnspin deutschland google.mw
References:
Hit spin casino https://solaris-forum.ru
References:
Monro Casino Slots yandex.ee
References:
Hitnspin bonus ohne einzahlung http://www.google.so/
References:
Hitnspin casino kundenbewertungen https://almanach.pte.hu/
References:
Monro Casino Freispiele https://astrologos.dpdcart.com/cart/add?product_id=126526&method_id=134849&referer=http://flowlink.me/prj8g
References:
Hit’n’spin casino erfahrungen https://www.usjournal.com/go.php?campusID=190&url=https://toyhou.se/~r?q=https://de.trustpilot.com/review/der-wikinger-shop.de
References:
Hitnspin casino registrierung maps.google.com.bo
References:
Hitnspin casino zahlungsmethoden cse.google.mu
References:
Hit’n’spin casino 25 euro bonus ohne einzahlung ruspagesusa.com
References:
Hitnspin casino zahlungsmethoden https://via.hypothes.is/www.adpost4u.com/user/profile/4534207
References:
Hitnspin casino review gazmap.ru
References:
Hitspin casino https://fxsklad.ru
References:
Hitnspin casino auszahlung erfahrungen piratebooks.ru
References:
Hitnspin casino bonus ohne einzahlung yami2.xii.jp
References:
Hitnspin free spins http://wikimapia.org/external_link?url=https://prpack.ru/user/violinjudo4/
References:
Hit’n’spin casino 50 free spins https://www.omicsonline.org
References:
Hitnspin casino echtgeld http://podvodny.ru/bitrix/redirect.php?goto=http://telegra.ph/Bonus-800–300-Freispiele-06-07-3
References:
Hitnspin online casino login.littlejoys.ru
References:
Hitnspin bewertung litsovet.ru
References:
Hit spin casino http://www.hungaricana.hu
References:
Hitnspin casino spielautomaten boxingforum24.com
References:
Hitnspin casino spiele https://audiosex.pro
References:
Lollybet Casino Login backlink.scandwap.xtgem.com
References:
Lollybet Casino PayPal www2.hu-berlin.de
References:
Lollybet Casino Login http://maps.google.co.uk/url?sa=t&url=http://school2100.com/bitrix/redirect.php?goto=https://lollybet.com.de/
References:
Lollybet Casino Blackjack ar.thefreedictionary.com
References:
Lollybet Casino Auszahlung https://go.115.com
References:
Lollybet Casino http://forum.vhfdx.ru/
References:
Lollybet Casino Roulette https://board-en.skyrama.com
References:
Lollybet Casino Zahlungsmethoden cse.google.no
References:
Lollybet Startguthaben http://wapcenter.yn.lt/load/index?url=platinum.social/vincehanran107
References:
Lollybet Casino mit Echtgeld https://yandex.ru
References:
Hitnspin free spins http://clients1.google.mv/
References:
Hit n spin freispiele http://cse.google.bi
References:
Hit’n’spin casino login http://cse.google.com.sg
References:
Hit n spin promo code http://maps.google.com.gt/url?q=https://www.altamira.edu.ec/profile/robertsontywmcfarland2276/profile
References:
Hitnspin casino gutscheincode clients1.google.com.bh
References:
Hit casino http://clients1.google.iq/
References:
Hitnspin casino gewinne cse.google.ci
References:
Hitnspin casino login maps.google.ki
References:
Hitnspin casino auszahlung erfahrungen http://clients1.google.dk/