Las Vegas might seem like an uncommon place to bike. But its sunny weather, relatively flat topography, and nearby parks and recreation areas convince many people to use bicycles in their commutes and for exercise.
Nevada tends to fall in the middle of U.S. states for bicycle safety. Hundreds of cyclists are struck by cars across the state every year, but for its population, this rate is in line with other states.
Here is an overview of bicycle safety in Las Vegas and some of the steps the city and Clark County have planned to improve safety for cyclists and avoid bicycle accidents in Las Vegas.
Las Vegas Bicycle Accident Statistics
The Nevada Department of Transportation (NDOT) provides three data sources for traffic accident statistics. NDOT releases the Nevada Traffic Safety Crash Facts report that summarizes traffic accident statistics across the state.
NDOT also provides an interactive dashboard to explore traffic crash data collected between 2015 and 2020. This dashboard allows you to find detailed data for particular types of crashes, like fatal bicycle accidents.
Finally, NDOT has a crash map that shows the locations of crashes from 2015 to 2017. This map includes filters to focus on bicycle crashes. Unlike the Crash Facts report and the NDOT interactive dashboard, the crash map includes information on bicycle crash injuries.
Since these sources do not include statistics for 2021, the numbers below focus on the averages for the periods reported. They also include unincorporated Clark County and other areas associated with Las Vegas, including Summerlin, Southern Highlands, and The Strip.
Las Vegas averages about 490 bicycle accidents per year, according to the NDOT crash map. Clark County accounts for 82.7% of the bicycle accidents in Nevada. Washoe County, Nye County, and Carson City account for the remaining 17.3% of the state’s bicycle accidents.
The most dangerous time to ride is in the late afternoon and evening. The interactive dashboard shows that 56% of bicycle crashes occur between 6 p.m. and midnight.
Bicycle crashes in Las Vegas happen at a fairly even pace throughout the year, with a big dip in July and a small dip in August, according to the interactive dashboard. This dip is most likely due to the intense summer heat.
Las Vegas Bicycle Accident Injuries and Deaths
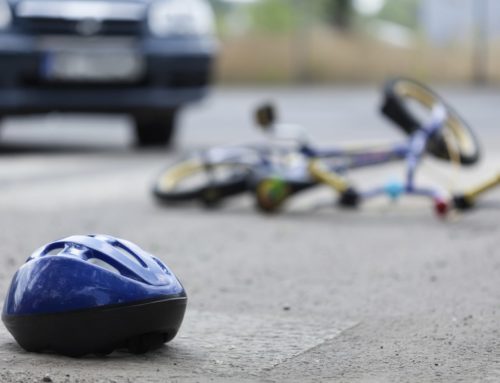
Las Vegas’s 490 bicycle accidents cause an average of 438 injuries and eight fatalities every year. This means that 90.7% of Las Vegas bicycle crashes cause injury or death.
Cyclists killed in Las Vegas are overwhelmingly male. According to the interactive dashboard, 88.6% of bicycle crash fatalities were male, while 11.4% were female.
The ages of cyclists killed and injured in Las Vegas bicycle accidents range from grade school children to senior citizens. But the age groups with the highest numbers of injuries and fatalities on the interactive dashboard are between 46 and 55 years old.
Of the 438 cyclists injured in an average year, about 37 suffer incapacitating injuries, according to the crash map. These injuries were so severe that the victim required ambulance transportation to the hospital.
Incapacitating injuries include both permanent injuries like paralysis and brain damage and temporary injuries like fractured bones and severe lacerations.
According to the crash map, another 144 cyclists suffer non-incapacitating injuries. Police reports use this code when cyclists have a visible injury but do not require an ambulance. Non-incapacitating injuries include bruises, minor lacerations and abrasions, and minor fractures.
The remaining 257 cyclists sustain possible injuries. As defined in the crash map, this means the cyclist had no visible injuries but complained of pain or other injury symptoms such as dizziness.
Causes of Las Vegas Bicycle Accidents
Las Vegas bicycle accidents tend to have a limited set of causes. According to the interactive dashboard, police reports blamed the driver for 94.4% of collisions between cars and bicycles.
Drivers blamed for hitting bicycles tended to be young or middle-aged. Nearly 18% of at-fault drivers were under the age of 25, and about 15% of at-fault drivers were between the ages of 51 and 55. Over 76% of at-fault drivers were male.
The most common cause of Las Vegas bike accidents on the interactive dashboard was improper turning or failing to yield at intersections.
Improper turning is when a car turns into or in front of an oncoming bicycle; failure to yield occurs when a vehicle goes through an intersection out of turn. Both of these driver errors happen when drivers either fail to spot a cyclist or ignore the cyclist’s right of way.
The second most common cause of bicycle accidents in Las Vegas is intoxicated driving or biking. When cyclists and drivers use drugs and alcohol, it can:
- Impair judgment
- Slow reflexes
- Interfere with balance
- Encourage risky behavior
The third most common cause of Las Vegas bike crashes is speeding. Speeding on a bike increases the odds that the cyclist will lose control; speeding in a car reduces the driver’s ability to avoid a cyclist.
Locations of Las Vegas Bicycle Accidents
According to the crash map, Las Vegas bike crashes tend to cluster in a few places, including:
Maryland Parkway
Accidents around Maryland Parkway are concentrated between Desert Inn Road and Tropicana Avenue.
The Boulevard Mall sits on the section between Desert Inn Road and Flamingo Road, while UNLV is located on Maryland Parkway between Desert Inn Road and Tropicana Avenue. Consequently, both of these areas have high levels of car, bicycle, and pedestrian traffic.
Sahara Avenue
The area of Sahara Avenue just east of The Strip also sees a large number of bike accidents. This section of Sahara Avenue is near residences, the tourist corridor, and a station for the Las Vegas Monorail.
Boulder Highway and Nellis Boulevard
Both Nellis Boulevard and Boulder Highway are busy roads on the east side of Las Vegas. This intersection exhibits a large cluster of bike accidents, including one fatal accident. It sits between two large casinos on Boulder Highway and near several apartment buildings.
The Future of Bicycle Safety in Las Vegas
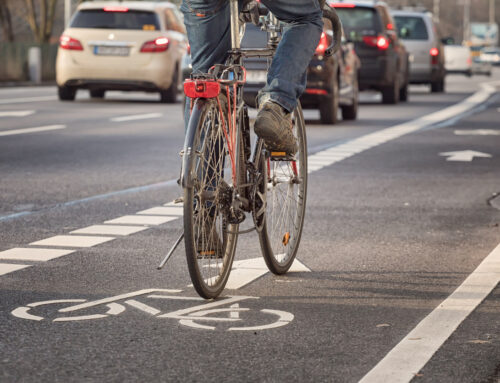
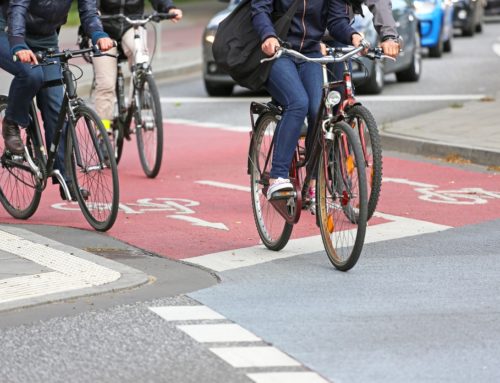
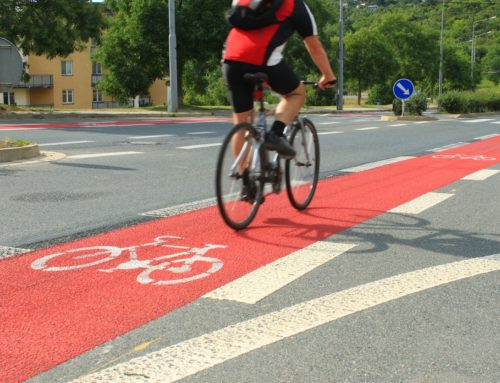
The Las Vegas Regional Transportation Commission (RTC) passed a plan in 2017 to expand facilities for cyclists across the valley. This plan includes adding bike lanes to major roads and creating mixed-use trails for pedestrians and cyclists. As RTC continues to build these routes, bicycle safety in Las Vegas should improve.
For more information, see our benchmarking report or contact us.



























































Leave A Comment